
Unstable equilibrium
Update on Oil and Commodities following the situation in the Middle-East


TLDR — Key takeaways
The Strait of Hormuz disruption is massive: ~20% of global oil flows pass through it, and current disruptions may already remove ~8–9 mb/d of supply, a shock equal to ~12–13% of global demand if sustained.
Strategic reserve releases won’t fully offset the loss: Even the IEA’s record 400-million-barrel release likely adds only ~1-1.5 mb/d, far below the scale of disrupted flows.
Resolution likely requires demand destruction: Historically, oil demand only falls after months of very high prices; markets may need $100–110+ (possibly closer to $130 in real terms) sustained for several months.
Positioning implications: Near-term oil contracts should remain tight (Brent > WTI), but prolonged high prices risk global recession, which would eventually hurt equities and industrial metals while supporting oil and fertilizers initially, but they will eventually correct too.
INTRODUCTION
I was planning to release Part 2 of my “Debunking Narratives” series this week, focusing on the AI/U.S. power “race.”
But I have found myself traveling quite a bit and lacking the time needed for the kind of deep dive that previous articles required.
The situation in Iran is also forcing my hand. I want to set down a few thoughts on what it means for oil in the short and medium term, as well as for other commodities.
The situation is evolving quickly, but I think it is worthwhile to lay out some key numbers and see what they might mean for our exposure to commodities and the potential impact on the global economy and stock markets.
SITUATION
On 28 February 2026, the United States and Israel launched coordinated air and missile strikes against Iran, hitting multiple cities and strategic targets, including military infrastructure and senior Iranian leaders.
Iranian leader Ayatollah Khamenei was killed alongside several members of his family.
Unlike last year, when missile exchanges appeared to be largely staged theatrics, we find ourselves in a genuine conflict this time.
Iran launched retaliatory strikes across the region, including missile and drone attacks against Israel and several Gulf states.
It also targeted critical energy infrastructure, including:
Qatar’s LNG facilities at Ras Laffan, forcing their closure
The ADNOC refinery in the UAE
Fuel tanks and storage facilities in Kuwait and, as of 11 March, in Oman
And most notably—and central to the current situation—the Strait of Hormuz is now de facto closed to navigation.
As of day four of the conflict, the Financial Times summarised the situation with the following infographic:
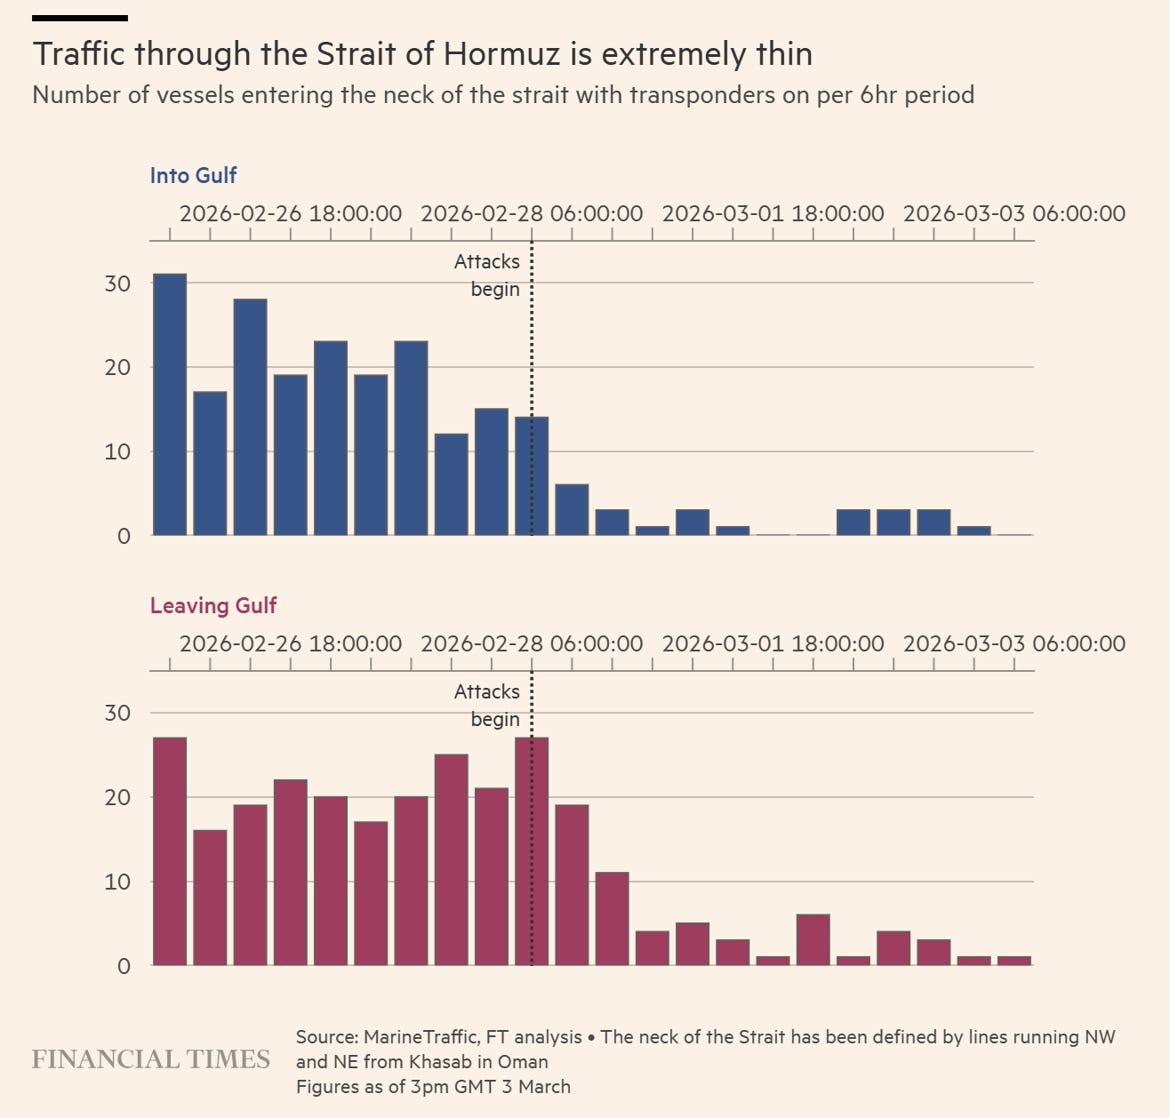
Traffic has effectively come to a halt.
And not much has changed after sixteen days.
A few tankers are still passing through (either Iranian or Chinese/Russian vessels), but most Aframax-sized and larger vessels are not.
Setting aside the humanitarian situation—which is tragic—and focusing on the impact on commodities, a simple fact check shows just how critical this part of the world is for the global economy:
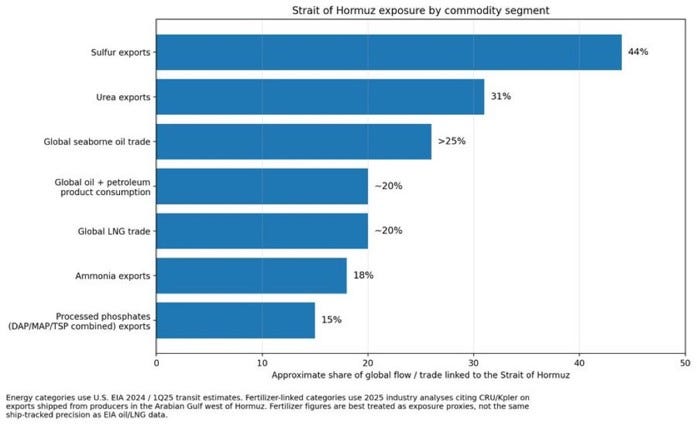
A massive 20% of global oil and petroleum products passes daily through that narrow strait.
This represents the starting point of many industrial supply chains, meaning our economies are directly exposed to any disruption there..
Furthermore, as you can see, two major components of the global food supply chain—sulfur (used for phosphate production) and urea (used to manufacture fertilizers)—are also affected, accounting for up to 40%+ of global volumes.
This will likely push up grain prices and could lead to food shortages similar to those seen in 2022 following the Russian invasion of Ukraine, particularly in poorer countries.
FOCUS ON ENERGY
Once flows stop, production is quickly impacted:
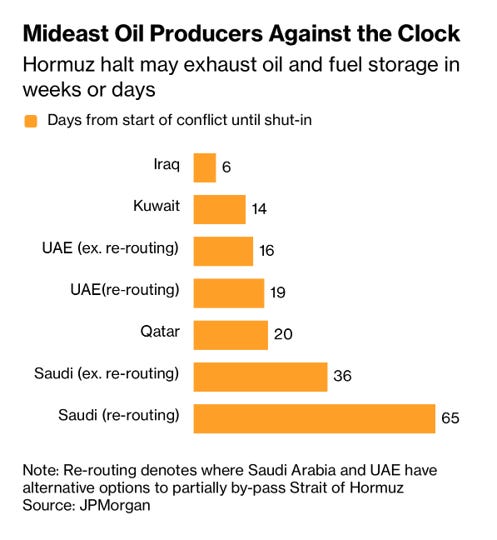
JPMorgan also published the following chart, which provides estimates of production shut-ins:
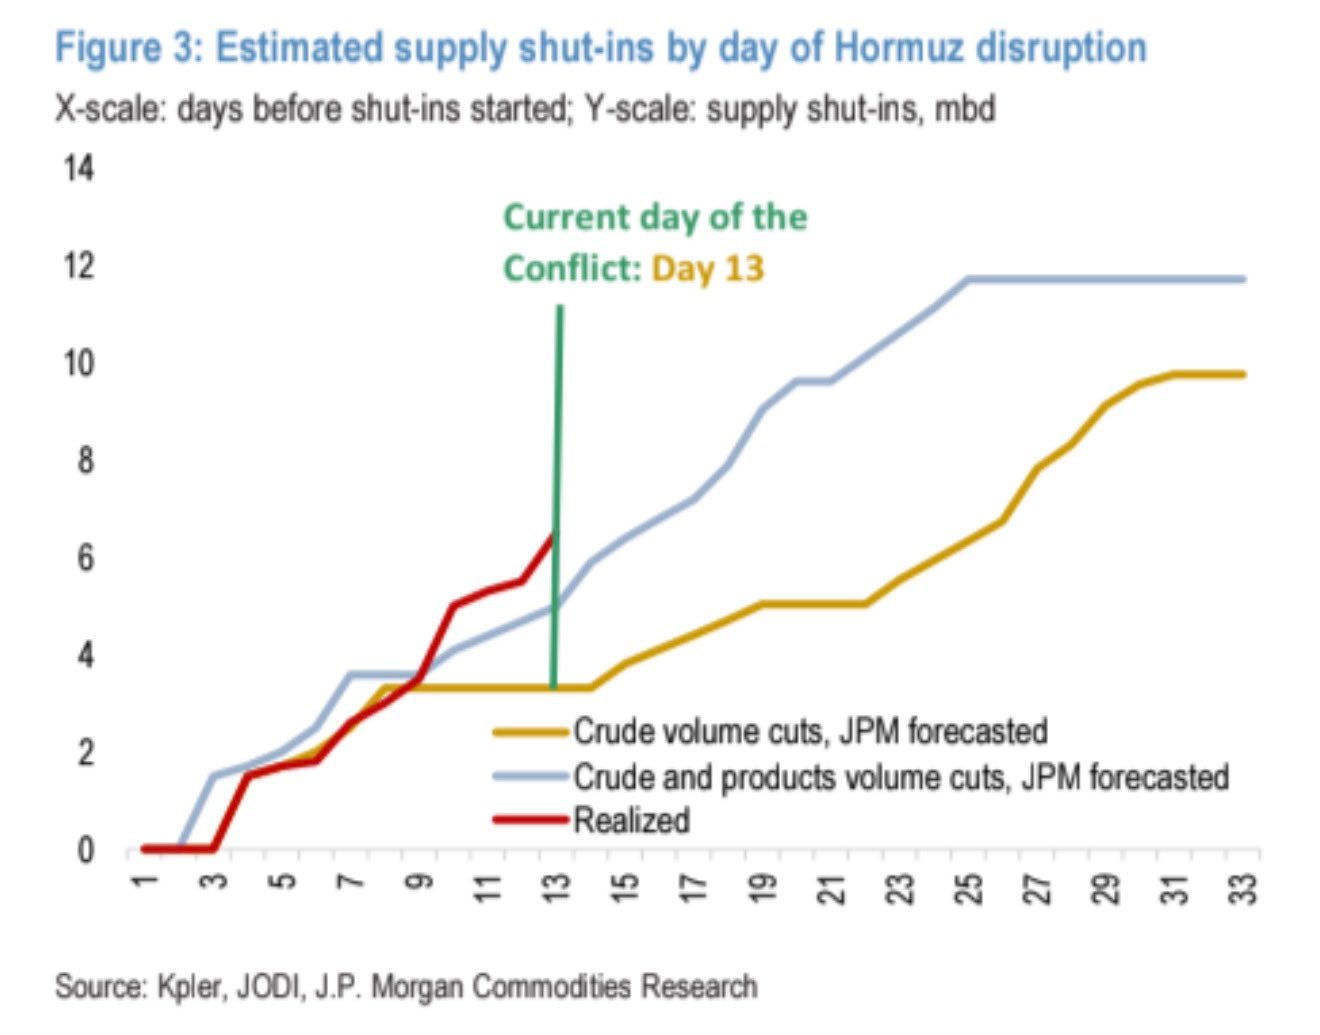
It puts into perspective the time dimension of the conflict: the longer it lasts, the more critical the situation becomes.
Note that after two weeks many fields face difficulties restarting, and doing so also becomes more costly.
Hence Strait of Hormuz flows must be monitored very closely.
Around 125-250% the size of the “super-glut” that some were forecasting for H1 has effectively disappeared … tough luck.
Javier Blas published several very useful statistics last week.
Notably to quantify what can (or cannot) be rerouted versus pre-war flow volumes:
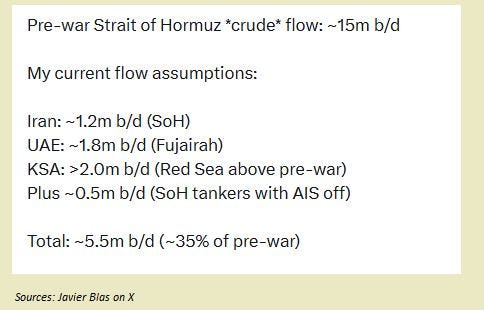
So rerouting still leaves us short by around 9.5 mb/d so far.
Note that total crude plus product flows were around 20 mb/d, significantly higher than Javier’s numbers.
INTERNATIONAL COMMUNITY RESPONSE TO OIL DISRUPTIONS
On 11 March 2026 the IEA announced a coordinated release of 400 million barrels.
This exceeds the 180 million barrel release of 2022.
At the time the maximum daily release from US SPR rate was about 1.2 mb/d.
JPMorgan estimates that this time the maximum flow could even be smaller, around 1 mb/d.
While expectations on 11 March were that Japan would quickly release around 80 million barrels (mostly crude), given the rerouting constraints highlighted above and the size of the lost flows, this may not be sufficient to offset the barrels already lost (over 200 million barrels as of the 11/03/26).
The total release rate for the group of 31 countries may therefore be between 2 and 3.5 mb/d.
In terms of flows we may therefore still be short roughly: –15 mb/d + 5.5 + 3.5 ≈ –6 mb/d.
Or about 11 mb/d if crude and refined products are combined.
HOW THIS COULD BE RESOLVED
Absent a rapid reopening of the Strait, the situation will ultimately have to be resolved through demand destruction1.
The size of the disruption mentioned above represents roughly 11 % of global demand.
This is massive.
I think taking a historical perspective is worthwhile.
Let’s look at past oil crises alongside price movements, supply disruptions and demand responses:
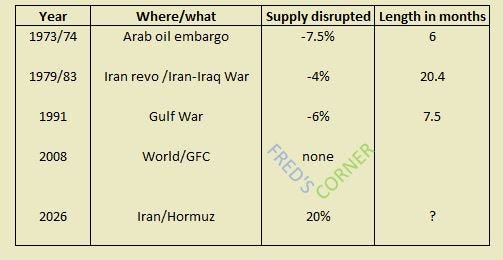
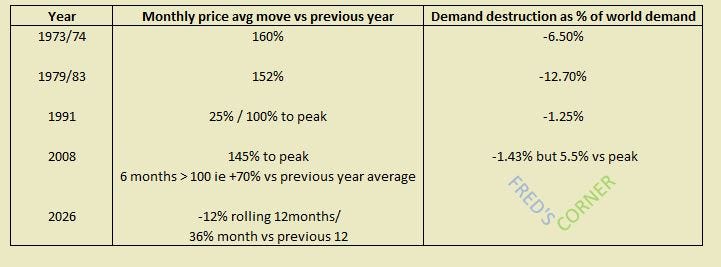
The above shows that oil price response has been so far quite subdued this time around, notably given the scale of the supply disruptions.
If the past is any guide, and speaking non-scientifically, it seems we would need conservatively prices above $100–110 on average for six months or more to trigger a significant demand response2.
Importantly:
this is an average price, meaning we would see larger spikes in the meantime
given barrels already lost I think for Brent the new floor is around 70-75$ until we see large demand destruction
Analyst Bernstein estimated on 10th of March that prices would likely need to exceed $90 if disruptions last three months, or around $110 if they last six months
UNSTABLE EQUILIBRIUM FOR OIL AND THE REST
My title comes from an important observation.
The price response to supply disruptions—and the resulting demand destruction—is a key concept for understanding how to position.
First, “international oil” (Brent) is primarily affected, so Brent should be preferred over WTI as protection against the current crisis.
Second, the most affected part of the curve should be the near term—perhaps extending six to nine months—until disrupted supplies are resolved.
Even if flows resume, the market will need time to recoup what has already been lost.
That said, if prices rise in the way I expect, it could trigger a global recession and push oil prices lower further out on the curve for several quarters.
Therefore the massive backwardation recently observed (when oil briefly spiked to $120 between 8–9 March) does make some sense.
However, if several months of high prices are required to:
recoup the lost supply
trigger demand destruction
Then contracts between July and October (and further out if the conflict persists) may currently be too cheap.
DURATION OF THE CONFLICT
I am not a geopolitical analyst, nor would I pretend to be one.
For that I defer to better sources. One of the best I have found so far is the podcast by former Stratfor analysts, Geopolitical Cousins.
Not only do they come from the best-in-class geopolitical shop Stratfor, they are sharp, highly informative, and very entertaining. I can only recommend following them.
Hats off to them for producing almost daily episodes recently—what I consider a real public service to investors !
In any case, my own takeaway on 11 March after listening to their most recent episode was that mining the Strait of Hormuz would represent a major red line for Iran and would significantly prolong the disruption.
According to US officials it has started.
PUTTING THIS ALL TOGETHER
I turned bullish on oil and related equities in Q4 last year.
The tenets of the thesis were positioning and risk-reward, given price levels at the time and the lack of confirmation of the “super-glut” thesis in oil market indicators.
I would like to say nothing has changed.
And I generally dislike actively trading my positions, nor is that the aim of my articles here.
But given the magnitude of current events, I need to update and reassess.
Quick summary:
I still like oil over the medium term, and the Dec-26 and Dec-27 contracts I bought remain sufficiently cheap for me to hold them. If oil spikes and demand destruction begins, I may close those positions, but Dec-26 should in my view rise further to incentivize demand destruction, so I am not touching it for now.
I rolled some call options up and further out the curve, which were designed precisely for events like this. Given current front-contract volatility (~100%+), I would not keep them concentrated in the front months.
I still like Dec 26 (implied vol in the mid 30’s on Brent) and plan to add to October 2026 call options if the Futures fall.I have kept my oil equities and remain comfortable with my focus on majors and my larger weighting in Brazil (Petrobras). Unlike 2022, when European majors benefited strongly due to LNG exposure, their Middle East exposure today may be more of a drag relative to Petrobras3.
A word of caution:
I would not expect a strong correlation between these equities and the front-month oil contract. Watch the curve instead.
The 12-24 month contracts matter more, since most producers do not sell at spot prices for the majority of their volumes.
A very steep backwardation could indicate a pricing dynamic where the front of the curve triggers recession, depressing contracts further out before eventually recovering in contango.
The importance of oil to global economies, particularly for energy-importing countries (essentially all developed markets outside the U.S.), makes me concerned about equity markets.
They currently appear far too sanguine about the risks.
I have therefore personally raised some cash and adopted a wait-and-see approach for the coming weeks or months.I have not written about it yet, but I remain overweight fertilizer companies, and given the current disruptions I continue to like the sector alongside oil producers.

LIKELY IMPACT ON OTHER COMMODITIES
Apart from grains, I am becoming somewhat concerned about the rest of the commodity complex—particularly base metals.
If the Strait of Hormuz disruption persists, the probability of a global recession rises quickly.
That would not be positive for oil in a second phase, but historically it has been particularly negative for industrial metals:
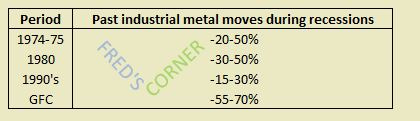
I have therefore brought down my large nickel position.
And reduced my overall commodity basket allocation described in December.
These are TACTICAL portfolio adjustments (and partially relate to the recent reduction of my financial portfolio cf risk on equities).
I am still of the view that (even at current oil prices as mostly only front has risen) most commodities outside of precious metals are too cheap.
It is unfortunate for many importing countries but I also expect Grains to outperform as a consequence.
And I have less of a strong view on Softs but I suspect they would suffer on the margin (except Sugar which is refined heavily in the region)., yet may stay flat given they have fallen quite a bit last 12-36 months (depending if you look at Sugar, Cocoa or Cotton).
CONCLUSION
Hopefully you have some real-asset exposure outside purely financial assets, as international developments remain volatile—as the Middle East currently demonstrates.
The “risk” is everything gets sorted quickly, it’s all rosy by next week and oil collapses and equity indexes rally. But sometime it is better to be safe than sorry.
Although I try to write more about “investments” than trading, I can only advise in current times, at least for “trading position”, to keep it small and be safe out there4.
As for any individual stocks mentioned, they are merely examples (many smaller producers could outperform depending on geography and hedging strategies), so as always: remember the DYODD.

Do Your Own Due Dilligence !
This post is NOT financial advice Thanks for reading !
Fred
Note that some countries that rely heavily on energy imports from the Gulf have already started implementing demand restriction measures.
This analysis is based on percentage moves relative to the prior period and historical episodes.
A better approach may be to perform the calculations using inflation-adjusted oil prices.
That would show that prices would likely need to rise above roughly $130 for around six months, as occurred during the 1979–82 and 2008 periods (in today’s dollar equivalents).
I am also trying to remain conservative. Given that the scale of the current disruption is unprecedented, I suspect we may need prices higher than the $110 suggested in my first method to generate the level of economic pressure required.
Note that on 12 March, the Brazilian government introduced a tax on “export profits” for oil companies. A quick back-of-the-envelope calculation suggests a 7–9% hit to net income. However, given the substantially higher oil price this year (potentially in a demand-destruction scenario as highlighted above), we could still see diluted EPS of around $7 per share for PBR in 2026, which would be very bullish.
Very helpful, Fred -- been worried about the outsized risk of front-month contracts.
P.S. Awesome that you're also in Kevin's group. I like reading your comments.
Which fertilisers do you own if you dont mind mentioning?