
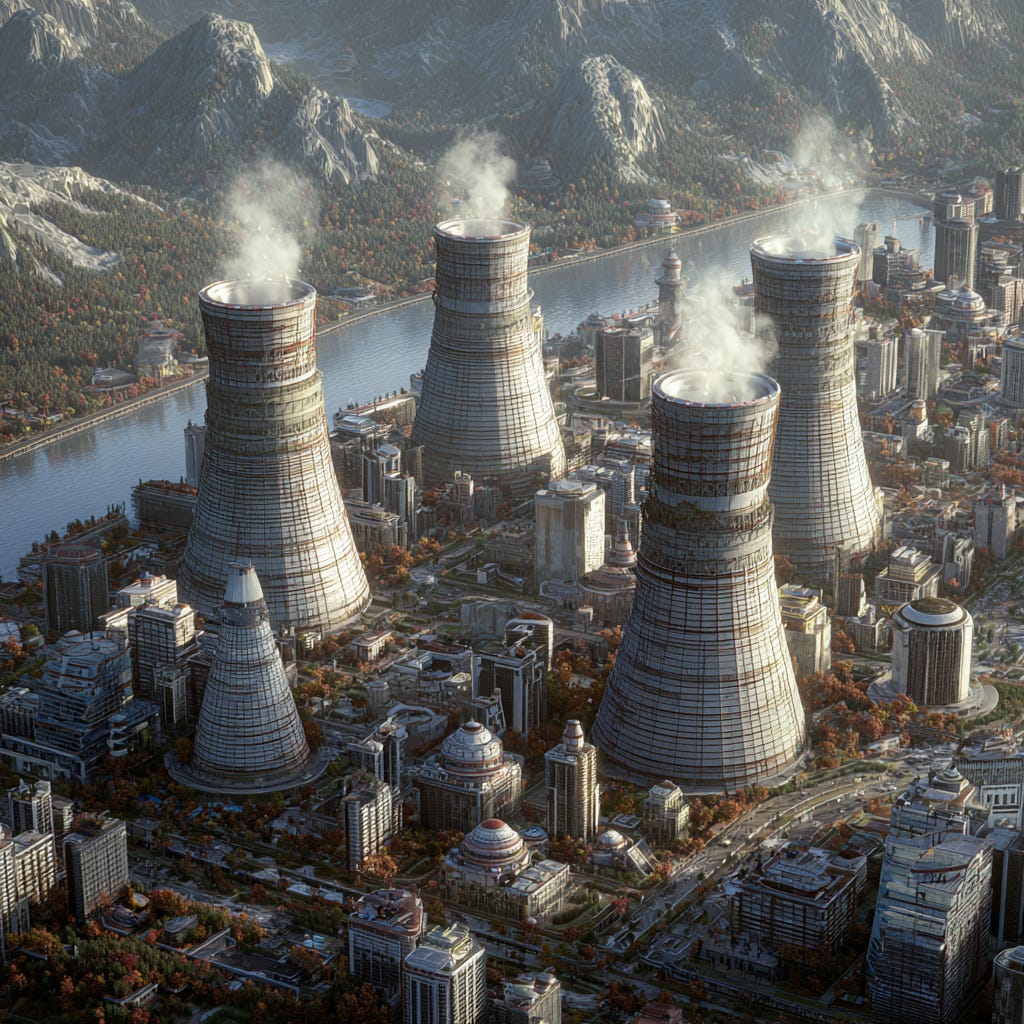
Let’s go Nuclear !
What does the Uranium investment case looks like

TLDR — Key takeaways
1. Strong Long-Term Fundamentals
Global nuclear demand is set to accelerate, especially in China, Russia, India, and other emerging markets.
Reactor additions over the next 15 years create a structural supply-demand gap that could widen to ~20,000 tons/year by 2030.
Current Supply Constraints
Primary mining supply is limited and secondary sources (stockpiles, reprocessing) are increasingly relied upon.
Post-2025, production growth is modest, meaning uranium markets may face recurring deficits similar to the 2000s, which historically drove large price spikes.
Investment Options and Risk Profile
Options include top uranium miners (Kazatomprom, Cameco) and physical uranium trusts (SPUT, Yellow Cake).
Miners outside the top players are speculative with near-zero production; geopolitical risk and valuation matter.
Physical uranium trusts allow investors to track spot prices closely, though premiums/discounts to NAV exist.
Recommended Approach
Treat uranium as a long-term, slow-moving trend: accumulate gradually near the bottom of an upward channel and maintain a multi-year perspective.
Market activity is currently tied more to risk assets than oil; government energy security initiatives are likely to provide further tailwinds.
INTRODUCTION
I started investing in the uranium space in 2020. At the time, the chart suggested strong potential for an upside breakout, and a report from Sachem Cove Partners—published in October 2020 and titled “Uranium: Climbing the Wall of Worry – Price is Everything”—further strengthened my conviction to take a sizeable position.
I exited the trade in Q4 2023. While I did not catch the absolute top, I was fortunate with the timing. Since then, I have largely stayed out of the space, only trading opportunistically without taking any major positions.
My previous article, combined with recent developments—particularly in light of the third oil shock currently unfolding—has led me to believe that it is time to revisit the sector and conduct a deeper analysis.
In particular, the current situation around the Strait of Hormuz could push countries to accelerate efforts toward energy independence. This, in turn, may provide a significant tailwind for the uranium sector.

HOW POPULAR IS URANIUM WITH HEDGE FUNDS AND THE RETAIL CROWD
The reason I decided to reduce my positions in 2023—and to largely stay out since—was that the long uranium trade was becoming increasingly crowded.
At the time, it appeared that WallStreetBets and other “YOLO” retail investors had uranium on their radar following the significant price increase in 2023.
I did not keep a record of all the tweets and posts from that period, but even recent sources like these give me pause:
an entire Reddit WallStreetBets page dedicated to uranium, as well as a growing number of TikTok finance influencers focusing on the theme.

Secondly, there were reports—including this article from HedgeWeek indicating that hedge funds were significantly increasing their exposure to uranium:
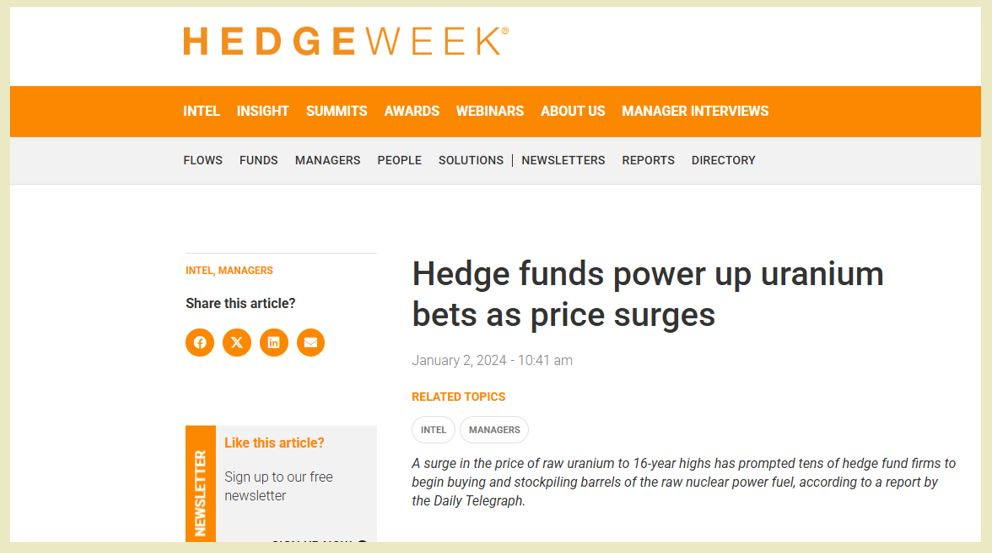
Yet, for the reasons outlined above, I believe it is worth revisiting the sector’s fundamentals.
So, what does the supply and demand picture look like?
DEMAND
As mentioned in my previous article, Debunking Narratives – Part 2, the world is building a significant number of nuclear reactors that are expected to come online over the next 15 years.
Today, there are 438 reactors in operation worldwide.
In terms of nuclear electricity generation (in TWh) as a share of the global total, the picture is as follows:
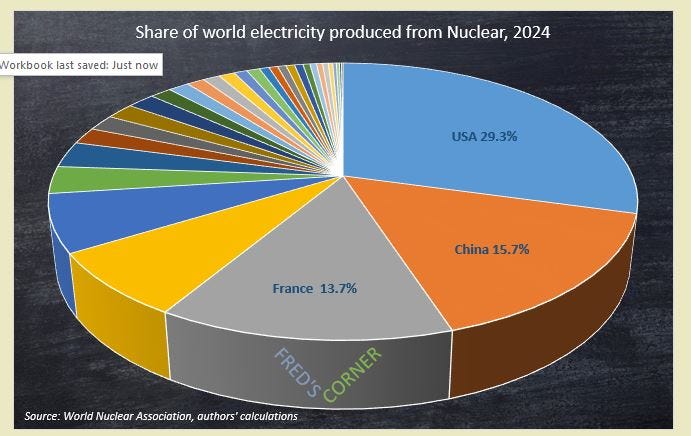
Demand is set to accelerate, with many reactors currently under construction and many more either planned or proposed.
The various forward-looking capacity scenarios are well summarised as follows:
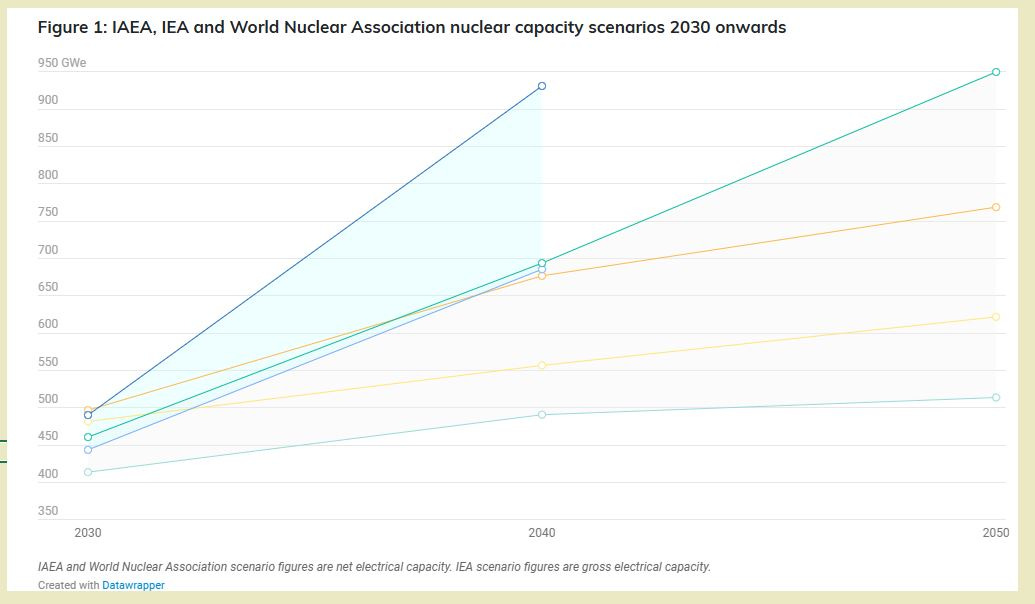
China represents roughly half of future new demand.
The largest developers after China are expected to be:
Russia
India
Egypt
South Korea
Turkey
It is also worth noting that a number of smaller additions are planned across many other countries beyond those listed above (see full list here).
In my previous article, I began working on projections through to 2040 and arrived at an estimate of around 550 GW—very close to the IEA’s central scenario (yellow line).
SUPPLY
Today's reactor fuel requirements are met from primary supply and secondary sources: commercial stockpiles, nuclear weapons stockpiles, recycled plutonium and uranium from reprocessing used fuel, and some from re-enrichment of depleted uranium tails (left over from original enrichment).
These various secondary sources make uranium unique among energy minerals.
This dynamic is well illustrated by a chart that remains one of my favourites in the sector:
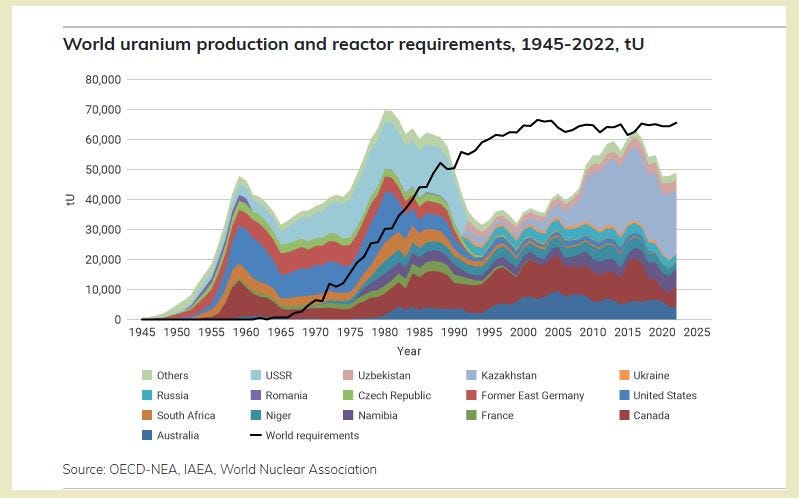
Stacked, the chart shows the various sources of mined supply since 1945.
Superimposed, the black line represents the volume required for civilian use—i.e. power generation.
Initial demand was therefore primarily (if not entirely) driven by military needs. However, as we can see, power generation became virtually the sole source of demand from the 1980s onward.
Now, note the large supply gap that emerged around 1990 and persisted until roughly 2015.
This is what the earlier discussion referred to: a significant reliance on drawing down civilian stockpiles.
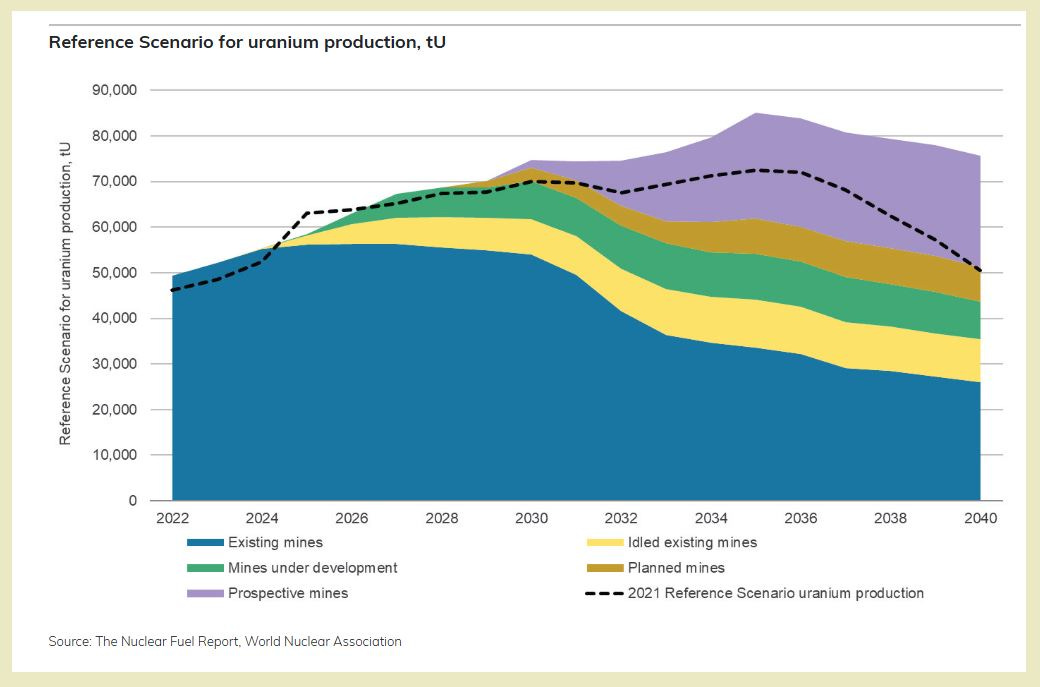
Looking ahead, production estimates are well summarised in the following chart:
Both can be found here.
The central scenario, “Reference,” is shown as the black dotted line.
Note that it does not appear to grow much beyond 2025.
WHAT DOES THE FUTURE SUPPLY AND DEMAND LOOK LIKE, THEN?
Using the above data for the central supply scenario and overlaying the three IEA future demand scenarios, we can recreate my favorite chart of combined supply and demand to see whether any shortfalls may appear.
We get the following:
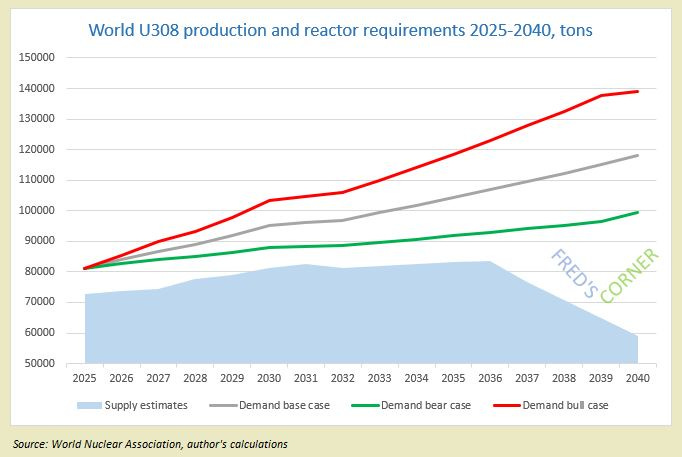
Clearly, more supply from the secondary market will be needed.
By 2030, the gap begins to widen significantly, reaching 20,000 tons per year.
This occurred during the 2000s and led to a tripling of the U₃O₈ price.
HOW TO INVEST IN THE SECTOR
There are several ways to play the uranium theme.
First, you can buy specialized uranium miners, either directly or via ETFs1.
The top seven producers in the world (by market capitalization) have the following valuation metrics:
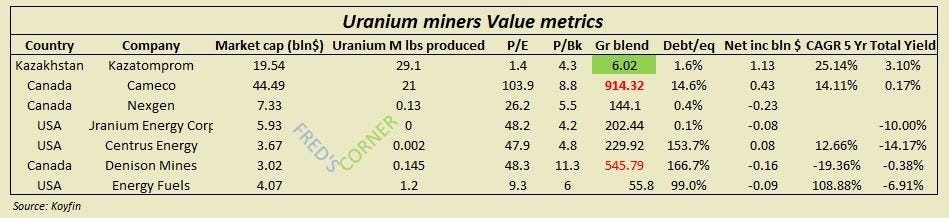
Kazatomprom, from Kazakhstan, is by far the largest producer, alongside Cameco.
It is also the only company with reasonable valuation metrics, as far as I am concerned.
Even so, I would not enter it right now.
I held it when the dividend yield was north of 8%, but the case is less compelling today.
It also carries a geopolitical discount, given that Kazakhstan is within Russia’s sphere of influence.
Cameco, meanwhile, has benefited from strong price appreciation. To many institutional investors, it is the only practical option to invest in the sector, either due to its size or regulatory constraints.
The remaining companies are highly speculative, as highlighted by their near-zero effective production.
Surprisingly, uranium can also be “owned” via a couple of investment vehicles:
Sprott Physical Uranium Trust (SPUT), listed in Toronto and on the OTC market in the US
Yellow Cake Plc, listed on the London Stock Exchange
These two closed-end funds / trusts:
Hold physical U₃O₈ in regulated storage
Move broadly with the uranium spot price
I say broadly, as both have experienced significant discounts or premiums to NAV over the last few years.
Nevertheless, they are the only vehicles that truly allow investors to follow the uranium price closely.
The history of these NAV deviations for the Sprott vehicle can be accessed on the fund’s page here:
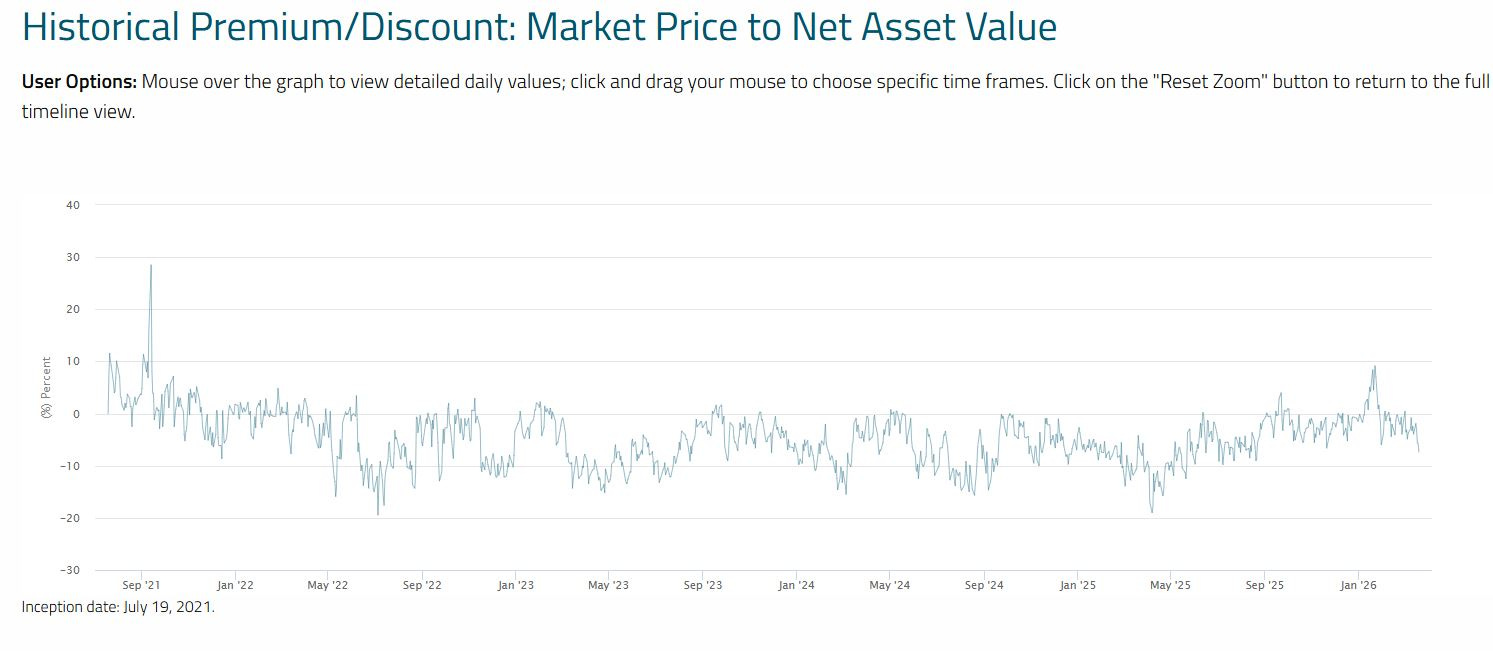
There are actually ways to benefit from discounts, and they have provided signals.
I will leave it to those of you who trade to draw your own conclusions.
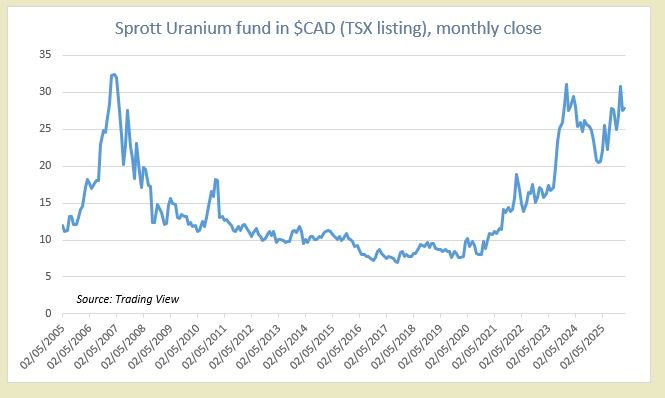
I would also like to highlight two points I mentioned earlier.
The price has been volatile:
And secondly, if we zoom in on recent history, a clearer upward trajectory emerges within a band that one could use to enter positions or trade around:
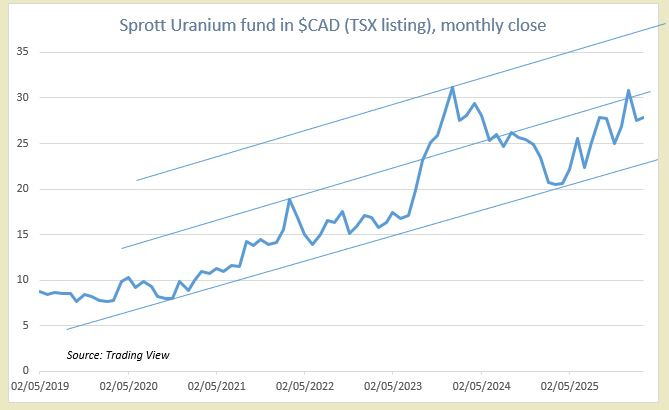
Given the very large deficits expected to build over the next 15 years, I believe it is worth being invested in the theme, and I plan to re-enter a position once the risk environment becomes more stable — ideally closer to the lower end of the range.
I also note that uranium has not recently traded in line with oil or oil products, and remains more closely correlated with risk assets and US stock indices. This underscores my main point from Debunking Narratives - Part 2: for now, the best approach is to treat uranium as a long-term investment — accumulating gradually near the bottom of an upward channel while maintaining a long-term perspective.
This approach may change around or after 2030, when the supply-demand gap is expected to widen substantially.
CONCLUSION
The fundamentals for uranium remain strong.
For now, I continue to view it as a slow-moving, long-term trend, likely to last many years given the expansion plans already in the pipeline.
Additionally, uranium should benefit from government initiatives aimed at expanding energy security, a theme that will likely be high on policymakers’ agendas following recent events in the Middle East.
This is a sector to watch closely.
As always: remember the DYODD.

Do Your Own Due Dilligence !
This post is NOT financial advice Thanks for reading !
Fred
Main ETFs: Global X Uranium ETF (URA) and Sprott Uranium Miners ETF (URNM). They both hold a portion of direct Uranium exposure via SPUT.
Thanks Fred, nice piece.
I’ve been in YCA from 2019 and continue to hold it.
As for miners, you can’t include NXE, they don’t produce anything other than hype and WTF are they doing sponsoring Aston Martin F1 team !!!!! Bad sign.
Far better off in PDN, a real producer at a discount to NAV and you can buy it in either AUD or CAD to enjoy the currency trade as well.
Hopefully this link works
https://canaccordgenuity.bluematrix.com/sellside/EmailDocViewer?encrypt=b5c35bf9-a396-46ed-ae42-c4aaff8a2942&mime=pdf&co=Canaccordgenuity&id=info@alphasecurities.com.au&source=mail
Cheers,
Hey, great post! I think your valuation metrics of the miners are off, however, or I might misunderstand the table? Because Kazatomprom is not trading at 1x p/e, and NexGen does not have any earnings, so the p/e should be negative.